FX4152708566
2021年5月17日 00:28 发表于

澳大利亚
 举报
举报
这些Acy图表是否经过验证可以操纵,还是Acy犯了一个错误?
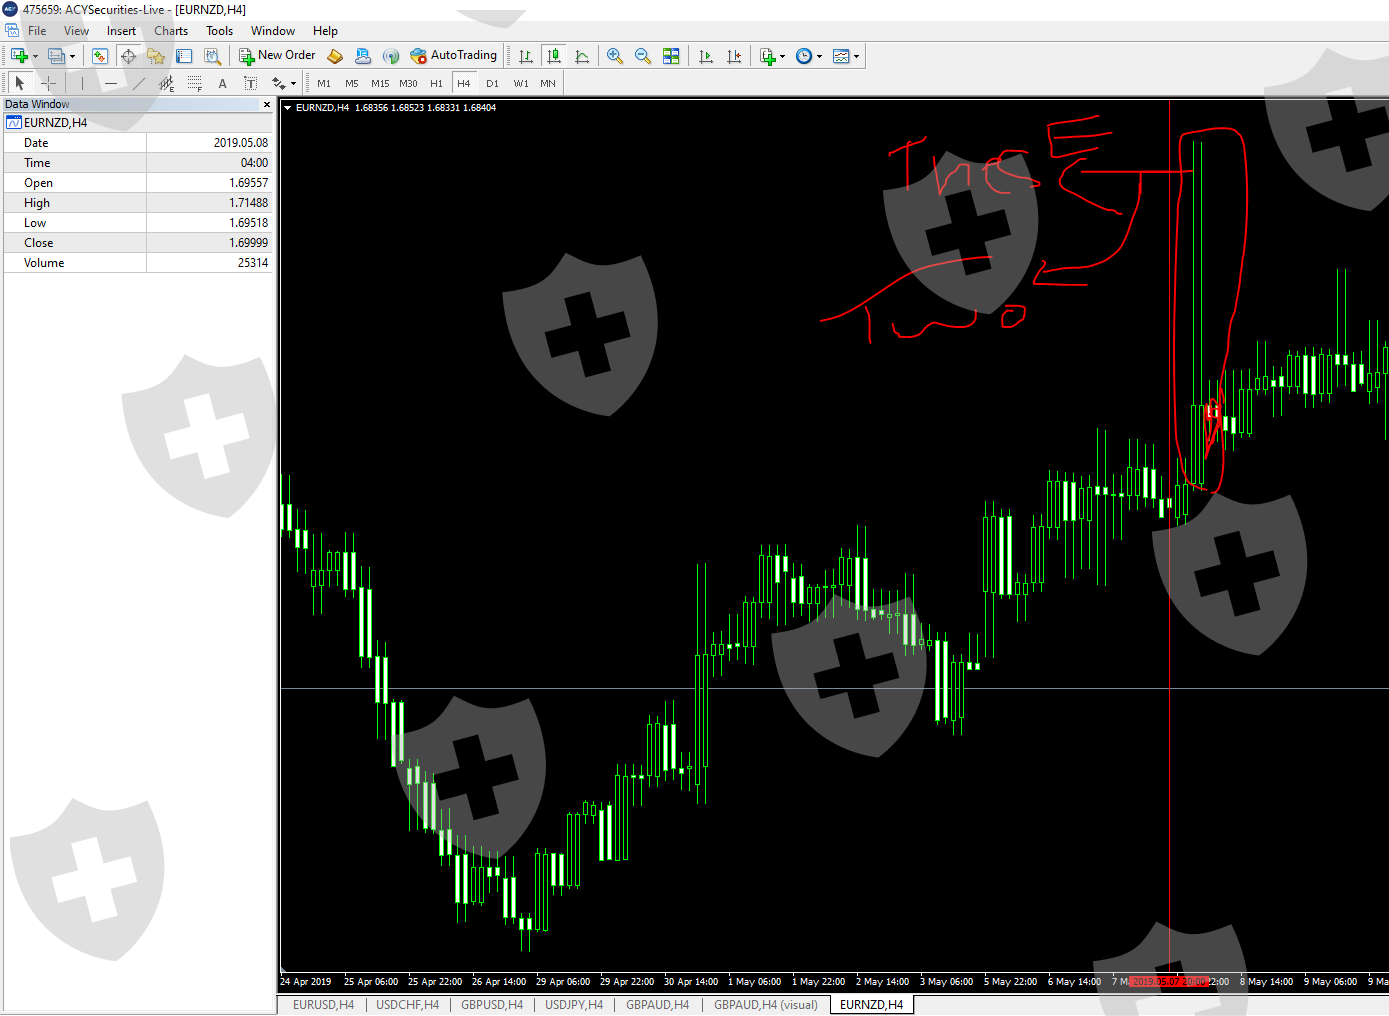
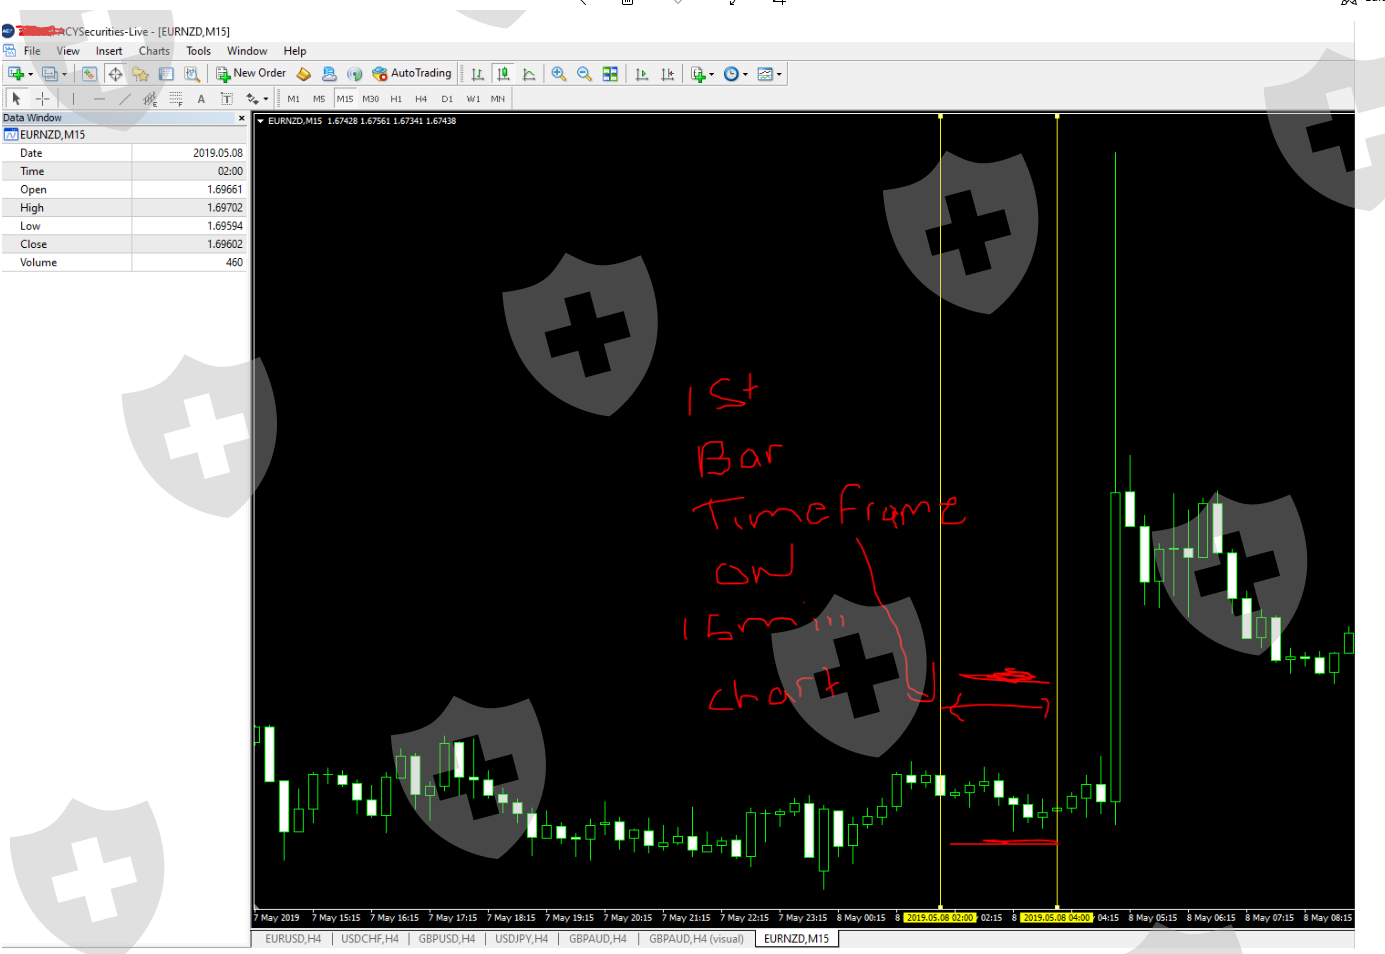
下面是4小时图表上Acy数据的快照。“ 4小时图表上的2小时柱。”两者之间的价格差距从不以任何方式与任何较小的时间框架图匹配。 Acy说这是正常现象。谁曾在4小时图表上听到过2小时柱线。仔细检查后,图表中会同时显示2个不同的价格,而15个图表上的这些价格存在2到4小时的时滞我觉得这表明Acy已被操纵以操纵价格,也被Acy通过改变平台上的某些东西阻止了我使用经过验证的高端Ea。使用这些ea,我赚了很多钱。突然之间,EA被拒绝访问该平台,Acy从一开始就完全忽略了我,Acy在购买Synergy FX时也购买了我的交易。价值约4万美元。现在我失去了很多。请查看下面的图表。 15分钟图表涵盖了4小时图表上2小时柱的两个时间范围。
以下为原文内容
Does These Acy Charts Proven Manipulation Or Have Acy Just Made A Mistake?
Below is a shot of Acy's data on a 4hour chart." 2 hour bars on a 4 hour chart." REALLYI bar of the two never matches up to any smaller timeframes chart for price in any way. Acy SAY THIS IS NORMAL.Who has ever heard of 2 hour bars on a 4 hour chart anyway.With closer examination it shows 2 different prices happening in the charts at once ,with a 2 to 4hour time lag in these different prices on the 15 min chart.I feel this shows that Acy have been caught manipulating prices red handed.Also Acy have stopped me using proven high end Ea's by changing something in their platform. I was making good money using these ea's. Then all of a sudden the Ea's were denied access to the platform.I have been totally ignored from the start by Acy.Acy also bought my trades when they purchased Synergy FX. Around $40 k worth. Now I have lost the lot. Please look at the charts below.
The 15 minute chart cover both timeframes of the 2 hour bars on a four hour chart.